The Bujak Database is an essential resource for all companies evaluating Paleogene plays in the North Sea/West of Shetland areas. It provides improved stratigraphic calibration for both hydrocarbon and energy transition projects.
The database features biostratigraphic, lithostratigraphic, sequence stratigraphic and chronostratigraphic data presented with consistent interpretations by Dr. Jonathan Bujak, an expert in this field. The database can be bought in its entirety or as bespoke subsets according to project needs.
For more background information on the evolution of the Paleogene, see Dr. Bujak’s technical blog post.
deliverables
Self-Contained Stratabugs Database file compatible with Stratbugs v3.0
Stratabugs Export Files
PDF plots of Stratabugs charts (examples below) for individual wells or correlations of selected wells plotted by depth, age or TWT (if TWT data are available)
Reference wells including Paleogene discoveries and type sections with detailed biozones, bioevents and occurrence charts
Excel files of interpreted picks
Spreadsheets with available TWT plus oil and gas shows for selected reference wells
about the cOMPILER
Dr. Jonathan Bujak is a palynologist with 50 years experience. He has worked extensively on the North Sea and West of Shetland geology and biostratigraphy. Jonathan has published more than 100 papers including the definitive Paleogene biostratigraphic and sequence stratigraphic schemes for the northeast Atlantic, Hampshire Basin and eastern Canadian type sections.
Bujak Research International was founded in 1984 and rapidly became a premier international geological consultancy, specializing in the Americas, the Pacific-Bering Sea, the North Atlantic region and northwest Europe.
Database Well Locations.
example deliverables
Please click on the images below to see the full size PDF.
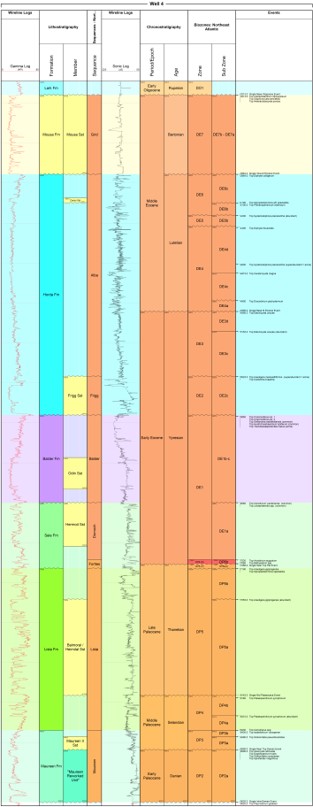
Well Summary Plot.
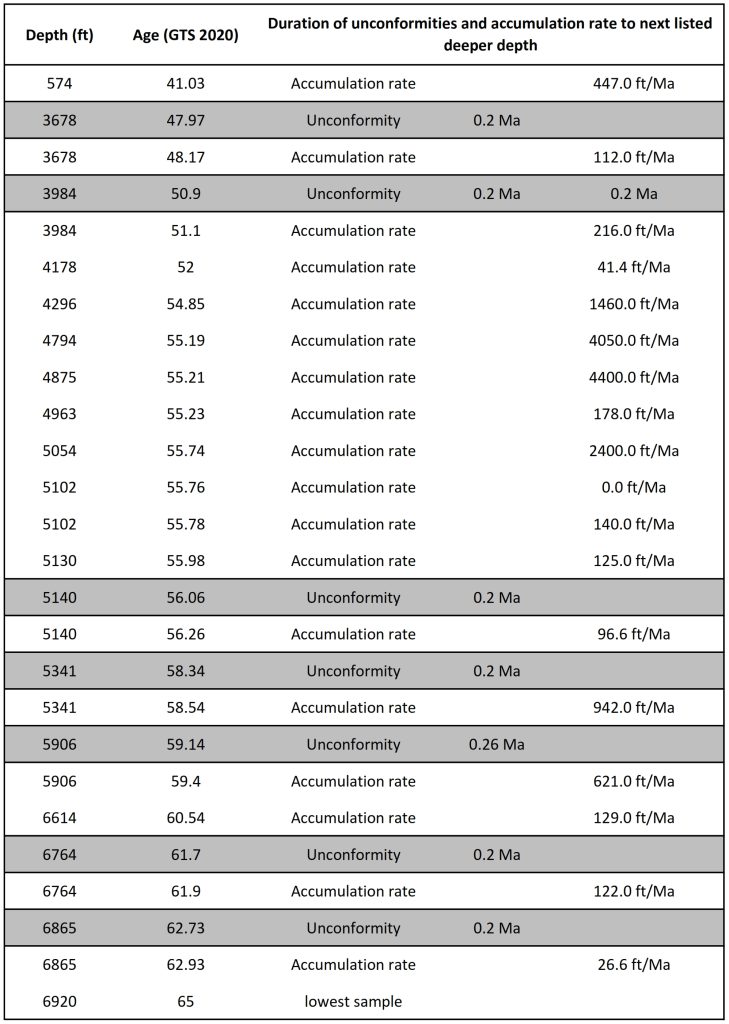
Example spreadsheet showing depositional rates of preserved sections and duration of unconformities in Ma (Geological Timescale 2020) in a well. Data are provided as flat files to facilitate import into clients’ databases.
Graphic Correlation Plot.
Linear Time Plot Showing Gaps.
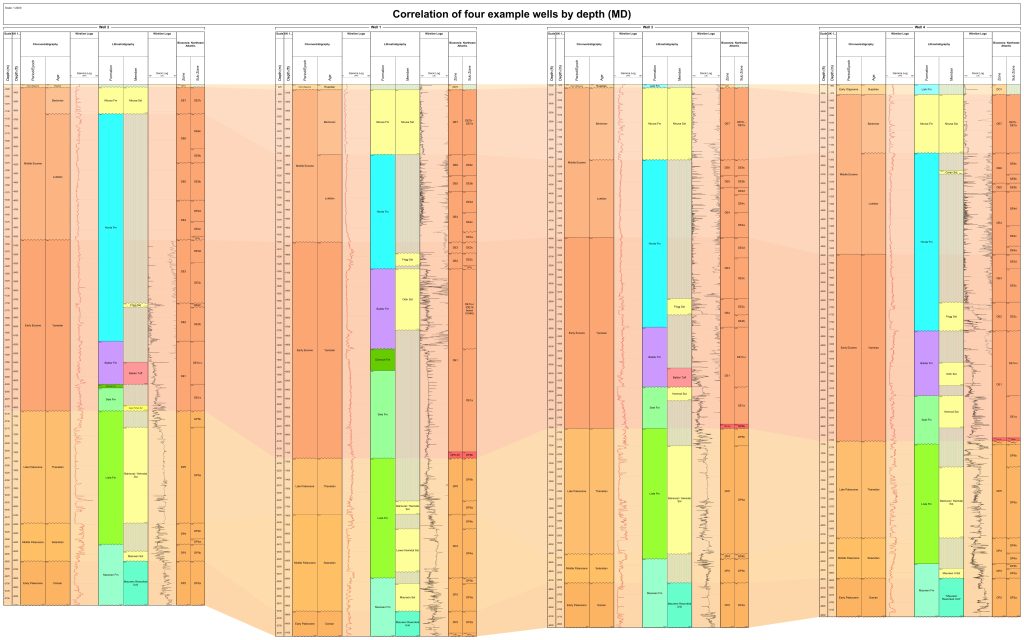
Example correlation of four wells.
Distribution Chart.
We use cookies on our website to give you the most relevant experience by remembering your preferences and repeat visits. By clicking “Accept All”, you consent to the use of ALL the cookies. However, you may visit "Cookie Settings" to provide a controlled consent. You can read our privacy policy here.
This website uses cookies to improve your experience while you navigate through the website. Out of these, the cookies that are categorized as necessary are stored on your browser as they are essential for the working of basic functionalities of the website. We also use third-party cookies that help us analyze and understand how you use this website. These cookies will be stored in your browser only with your consent. You also have the option to opt-out of these cookies. But opting out of some of these cookies may affect your browsing experience.
Necessary cookies are absolutely essential for the website to function properly. These cookies ensure basic functionalities and security features of the website, anonymously.
Cookie
Duration
Description
cookielawinfo-checkbox-analytics
11 months
This cookie is set by GDPR Cookie Consent plugin. The cookie is used to store the user consent for the cookies in the category "Analytics".
cookielawinfo-checkbox-functional
11 months
The cookie is set by GDPR cookie consent to record the user consent for the cookies in the category "Functional".
cookielawinfo-checkbox-necessary
11 months
This cookie is set by GDPR Cookie Consent plugin. The cookies is used to store the user consent for the cookies in the category "Necessary".
cookielawinfo-checkbox-others
11 months
This cookie is set by GDPR Cookie Consent plugin. The cookie is used to store the user consent for the cookies in the category "Other.
cookielawinfo-checkbox-performance
11 months
This cookie is set by GDPR Cookie Consent plugin. The cookie is used to store the user consent for the cookies in the category "Performance".
CookieLawInfoConsent
11 months
Keeps a record of your consent (or not) to cookies
viewed_cookie_policy
11 months
The cookie is set by the GDPR Cookie Consent plugin and is used to store whether or not user has consented to the use of cookies. It does not store any personal data.
Functional cookies help to perform certain functionalities like sharing the content of the website on social media platforms, collect feedbacks, and other third-party features.
Performance cookies are used to understand and analyze the key performance indexes of the website which helps in delivering a better user experience for the visitors.
Analytical cookies are used to understand how visitors interact with the website. These cookies help provide information on metrics the number of visitors, bounce rate, traffic source, etc.
Cookie
Duration
Description
_ga, _gat, _gid,_gtag
11 months
These cookies are used to collect information about how visitors use this website. We use the information to compile reports and to help us improve the website. The cookies collect information in a way that does not directly identify anyone, including the number of visitors to the website and blog, where visitors have come to the website from and the pages they visited.
Advertisement cookies are used to provide visitors with relevant ads and marketing campaigns. These cookies track visitors across websites and collect information to provide customized ads.