By Bill Wilks, Principal Geophysicist
I don’t know about you but one of the most enjoyable and rewarding aspects of working in geoscience for me is actually in getting it wrong! Where would the fun be if things always turned out just as we predicted? The mantra ‘expect the unexpected’ comes to mind when dealing with sub-surface data. The flexible geoscientist recognises the flaws in their data and uses their geological nous to fill in the gaps and to consider what might be, rather than what the data seems to be showing them. This spectacular example illustrates the point and, through a seismic re-processing exercise, happily delivers the ‘big reveal’. Read on..
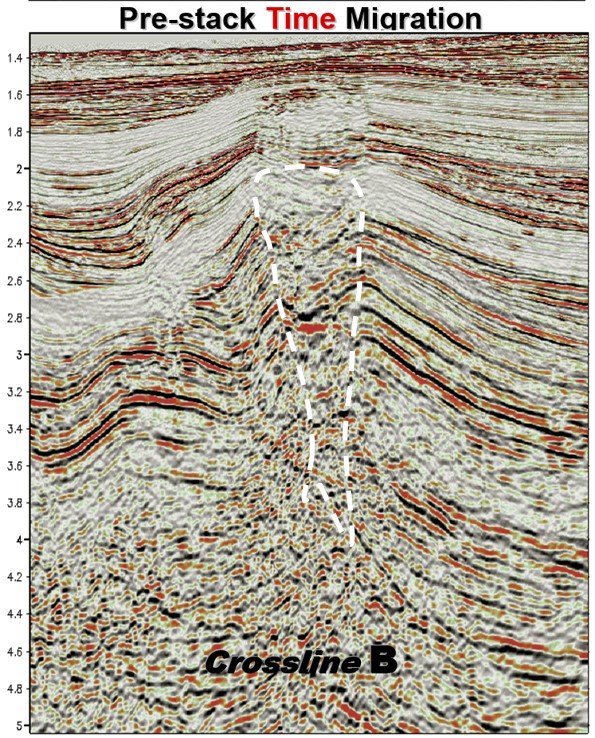
OK, let’s start with a challenge. Consider the seismic line shown here. To get you started I will say that it is from a deep water foldbelt and that the structure is an asymmetric hanging-wall anticline developed over a thrust which is verging towards the left. The question is, what is the nature of the central part of the anticline? I have seen many examples in the industry where the termination of seismic reflectors is taken ‘as read’ to define the lateral extent of a reservoir. Following this principle, the dashed white line in this example (added by myself) could be interpreted as a mud diapir which has penetrated and parted the overlying formations. The depression in the cover sediments could therefore be a collapse feature, related to emplacement of the diapir, or subsequent withdrawal. Are you OK with that? So many interpreters are, and mud diapirs are commonly interpreted in many analagous settings around the globe. If the diapiric interpretation is correct, then the hydrocarbon in place estimation may well be minimal and the exploration/appraisal decision would be “don’t drill”.
So, what else might it be? Well the structural geologists out there are probably already bristling with indignation! (I know I was). The other view would be to look beyond the seismic loops and consider that this is a simple hanging-wall fold that has been subject to seismic wipe-out, related to shallow gas (or other such velocity anomaly). Fortunately for us, the operators of this example were motivated to look beyond the data. They carried out a detailed anisotropic PSDM over the structure and fully constrained the effects of gas in the shallow sediments. So, now it is time for the big reveal!
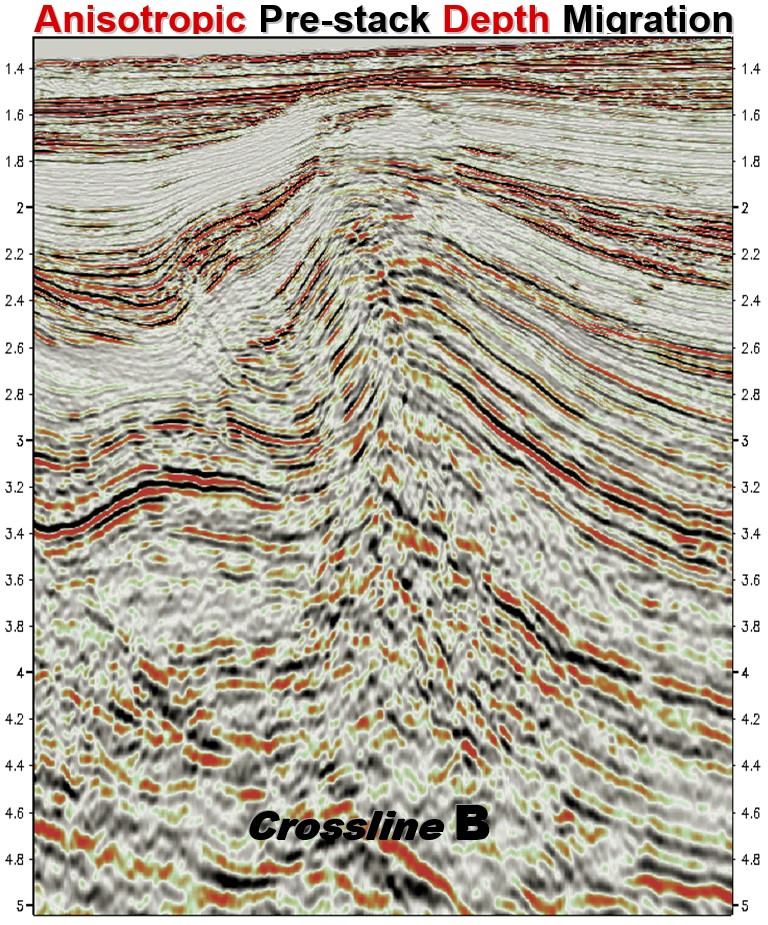
The PSDM result is one of the best that I have encountered in the industry. It confirms that the fold is complete and that the reservoir sequences extends all the way over the top of the structure. No diapirs necessary and no termination of reservoir. A drilling decision made on this data set would be very different. As this is one of the biggest oil discoveries in NW Borneo, the value is truly significant.
So, what are the morals of the story? Well for me it is simply that the interpreter needs to think about the geological evolution of any structure and be brave enough to consider multiple plausible alternatives rather than what the data seems to tell them. It is also important to learn about the tell-tale characteristics of imaging artefacts, such as shallow gas wipe-outs, and thus have the tools to recognise them in your data sets. The enquiring mind can then put a value on their ‘geological’ interpretation and propose re-processing efforts that may un-lock the hidden value. Finally, the re-processing must be done properly, as amply demonstrated here. If not, a half-hearted effort may deliver very similar results which may actually serve to re-enforce the initial dogma. The financial implications of getting these things right are truly huge.
Merlin is indebted to Osman Khan for his kind permission to show two of the figures from his superb EAGE conference abstract (full reference below). I encourage you to give it a read. It may become your poster child for PSDMs!
Khan, O. and Klein-Helmkamp, U. Deepwater imaging beneath gas anomalies – a case study. Abstract Z-99, EAGE 67th Conference & Exhibition — Madrid, Spain, 13 – 16 June 2005

