By Eleanor Oldham, Senior Geophysicist
Data visualisation is one of my passions. I love the feeling of taking a huge database of measurements and creating visualisations to discover the secrets held within. In the world of big data, visualisations enable us to extract the maximum value from our data as efficiently as possible. By using visualisations we can quickly identify and interrogate patterns in data, saving both time and money. Visualisations are also highly effective for communicating key conclusions with non-technical audiences, allowing big investment decisions to be made with confidence.
“Humans can process visual images 60,000 times faster than text” is an oft repeated phrase on the internet. Although this adage illustrates the point that if you repeat something often enough people will start to believe it, there is a core of truth to it. Humans are not good at looking at data tables and thinking “aha, column D correlates with column F”. However, a visualisation of the same data would take mere seconds to interpret.
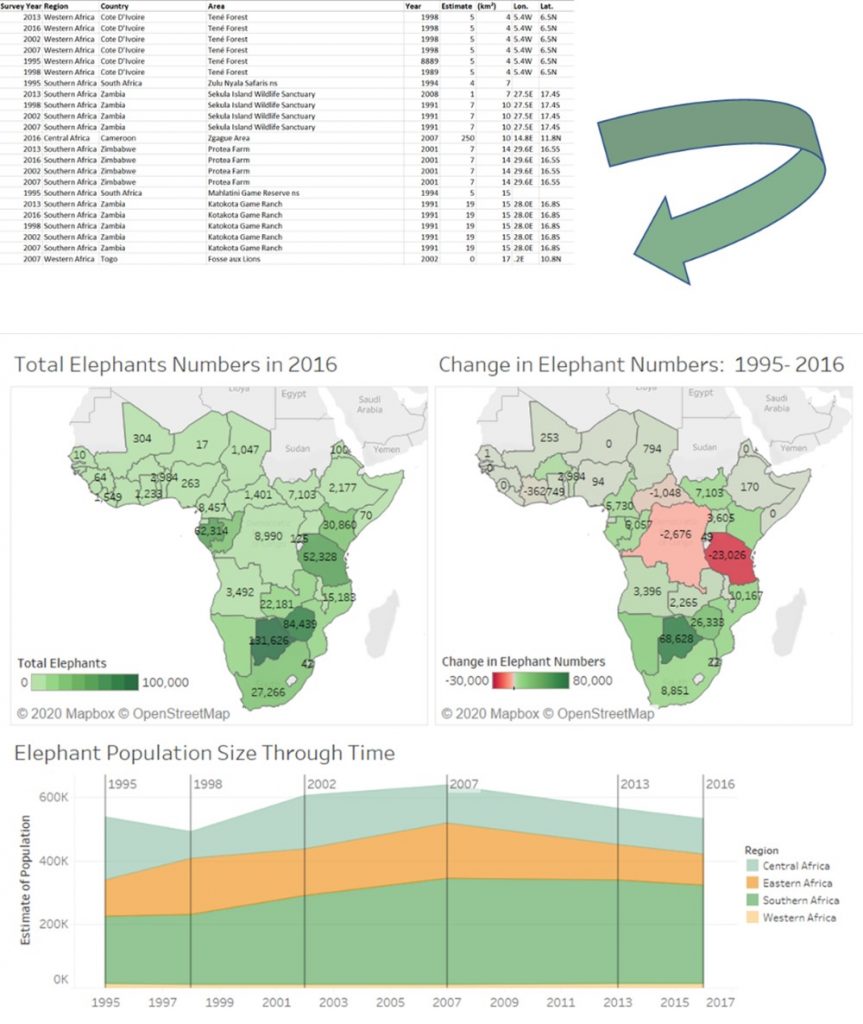
Elephant data from http://africanelephantdatabase.org
The images above show elephant population data across Africa. The visualisations make it easy to see which countries have the largest number of elephants and how these populations have changed over time. The raw, tabulated data contains exactly the same information but it is much less accessible for a human to interpret.
Data visualisation is useful for all stages of the analysis workflow. Visualisations significantly speed up the process of getting to know your data and are of immense value when trying to make interpretations. Communication is king though, and visualisations provide the most effective way of conveying conclusions to others. Choosing the best visualisation to summarise your findings is a skill which requires consideration of the project’s aims and who the audience will be. A good tip is to keep things as simple as possible: Throwing too many concepts into one visualisation is likely to confuse your audience.
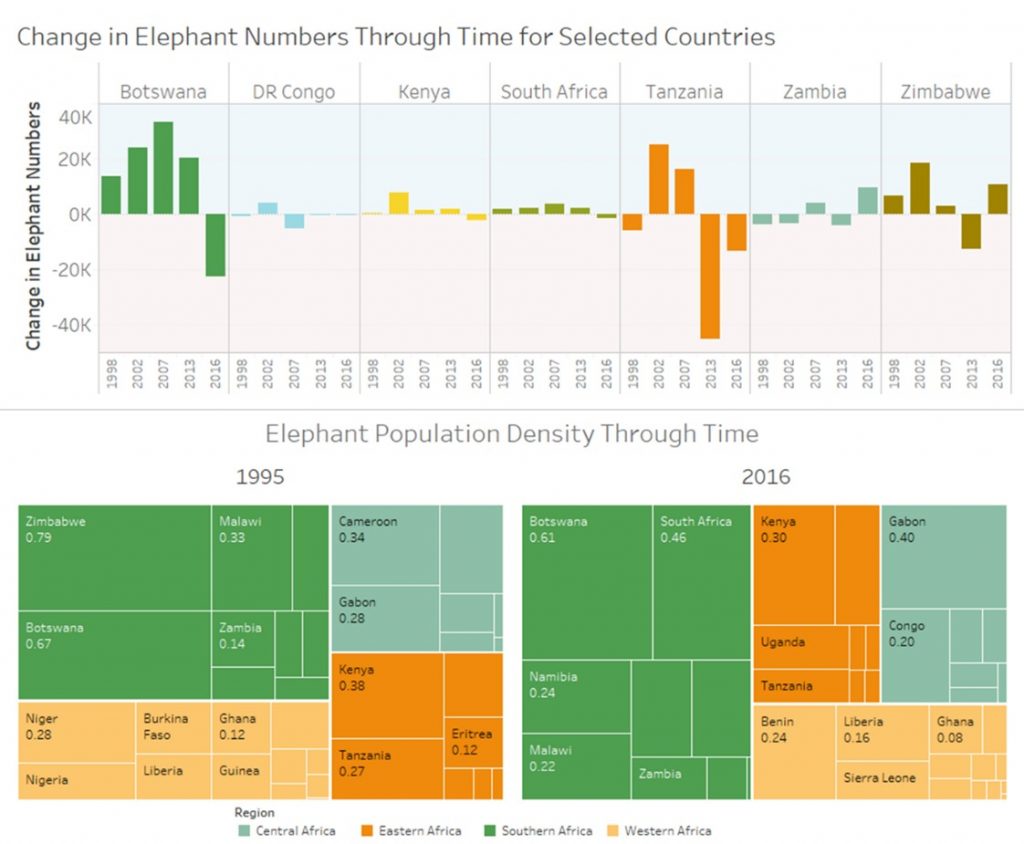
There are a great variety of visualisations to choose from to display your data
Elephant data from http://africanelephantdatabase.org
However, there is a dark side to data visualisation which I’m sure everybody’s encountered: Visualisations can be used to wilfully mislead their audience. Inconsistent graph axes can magnify or downplay differences between datasets, percentages may not add up to 100 % and correlation may be interpreted as causation. Reputations are hard earned and easily lost, so you don’t want to find yourself in the position of defending a confusing visualisation. Before publishing, it’s extremely important to take an objective look at your visualisations and consider how successful they are at getting the facts across. Another tip – the clearest way of presenting your findings might not involve the same visualisations you yourself used when exploring the data.
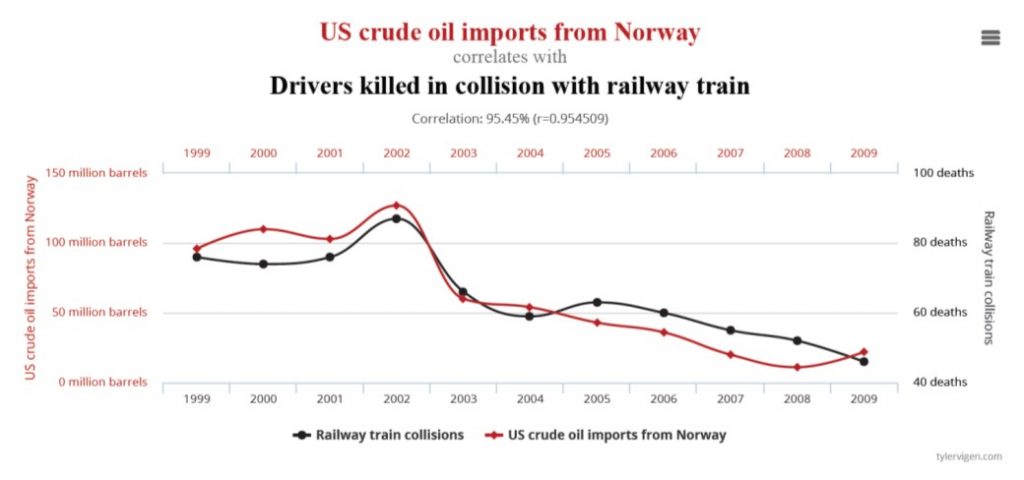
Example of a spurious correlation from www.tylervigen.com/spurious-correlations
Effective communication of data is a key skill in modern science. Done correctly, data visualisation enables large datasets to be quickly interpreted and then presented to audiences of all technical capabilities. But aside from the time you could save and the insights you could learn, data visualisation is also great fun! At Merlin we use data visualisation to gain a holistic understanding of our clients’ databases. The results are used to inform technical decisions as well as to provide high level summaries in corporate presentations, including farm-out campaigns. Please get in touch to find out how Merlin can maximise the value held in your data.

